- Update on Yield Inversion
On 16.03.2022, Fed announced rate hike of 0.25%. All of a sudden, we saw some huge action in Bond and equity market. While equity market cheered this move like there is no tomorrow and the Bond yields spiked all of a sudden. What was most awaited was the yield inversion. The US 3/10 year inversion along with US 5/10 year & US 7/10 year inversion while US 2/10 year yield inversion looks inevitable. The yield inversion is a sign of recession. Lets have a look at US Government Bond yield rates:
| S.No | Particulars | Interest Rate |
| 1 | US Government Bond 2 Year Yield | 1.92% |
| 2 | US Government Bond 5 Year Yield | 2.12% |
| 3 | US Government Bond 7 Year Yield | 2.17% |
| 4 | US Government Bond 10 Year Yield | 2.14% |
| 5 | US Government Bond 20 Year Yield | 2.50% |
| 6 | US Government Bond 30 Year Yield | 2.38% |
Note: For learners yield inversion happens when Short term Bond yields are more than long term Bond yield rates.
Update on Credit Default Swaps
Before we share some charts of CDS to our viewers, lets us explain in simple language that what CDS is all about:
CDS stands for Credit Default Swap. It is a financial derivative that allows an investor to swap or offset their credit risk with that of another investor. To swap the risk of default, the lender buys a CDS from another investor who agrees to reimburse the lender in the case the borrower defaults. Most CDS contracts are maintained via an ongoing premium payment similar to the regular premiums due on an insurance policy. A lender who is worried about a borrower defaulting on a loan often uses a CDS to offset or swap that risk.
In short its like insurance company giving you cover against risk of default.
Eg: If a company sells a bond with a $100 face value and a 10-year maturity to a buyer, the company agrees to pay back the $100 to the buyer at the end of the 10-year period as well as regular interest payments over the course of the bond’s life. Because the debt issuer cannot guarantee that it will be able to repay the premium, the debt buyer assumes the risk.
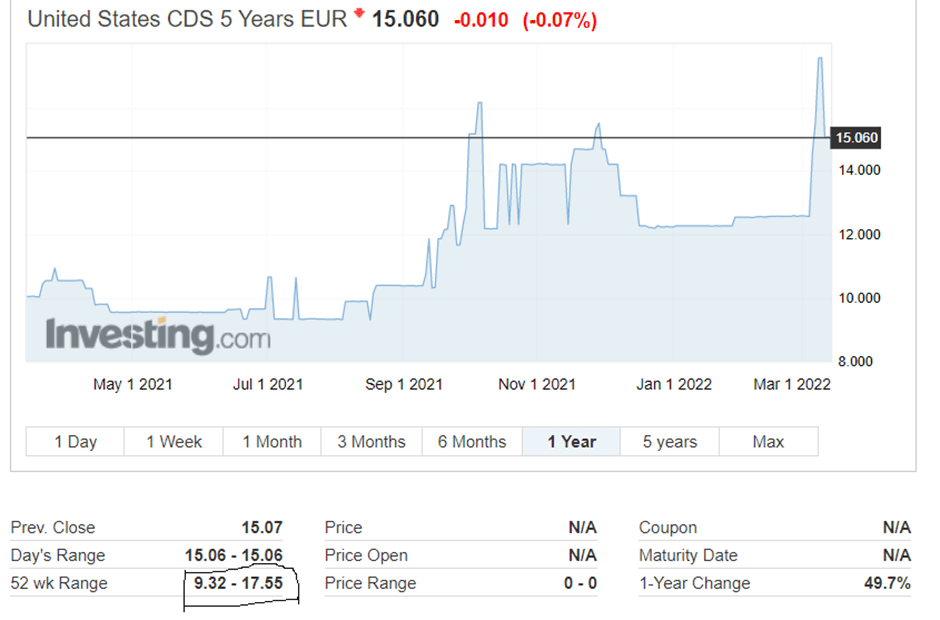
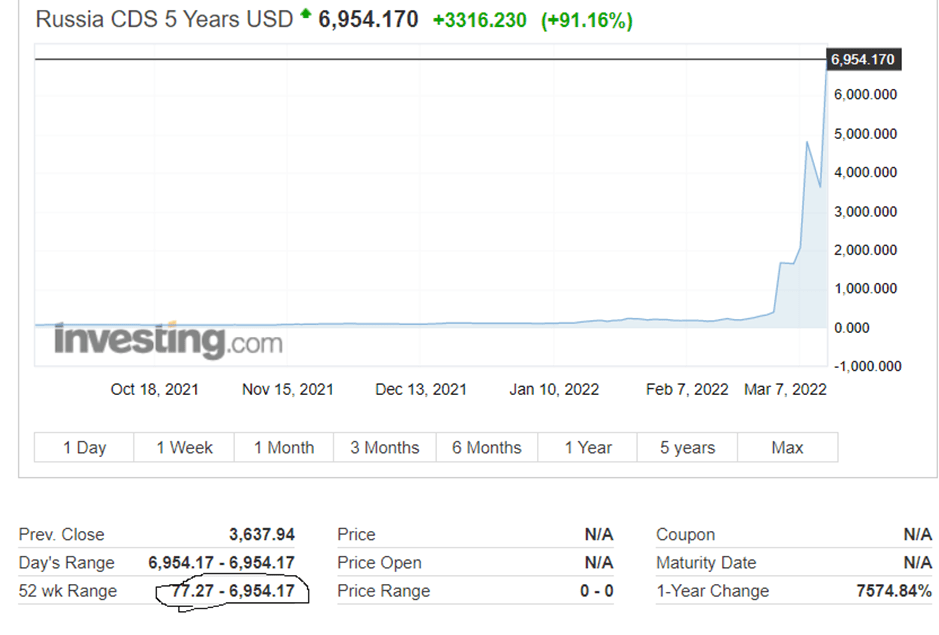
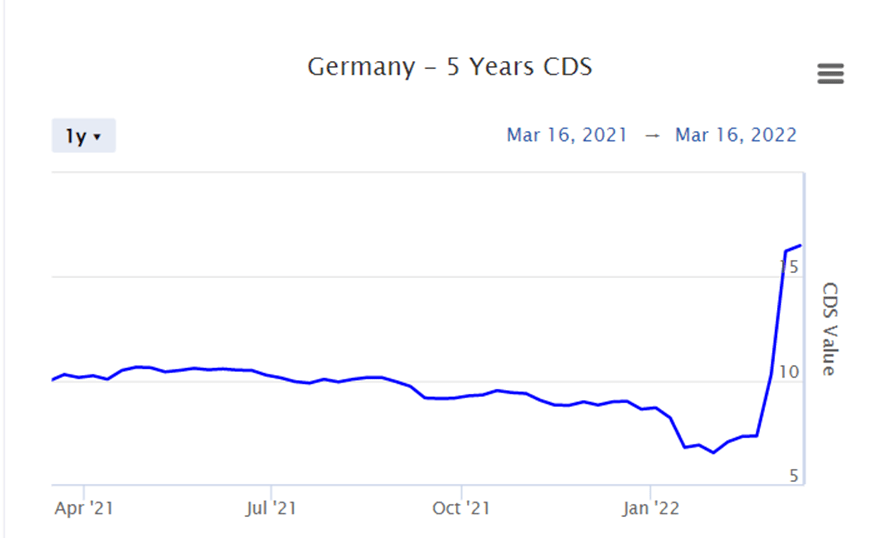
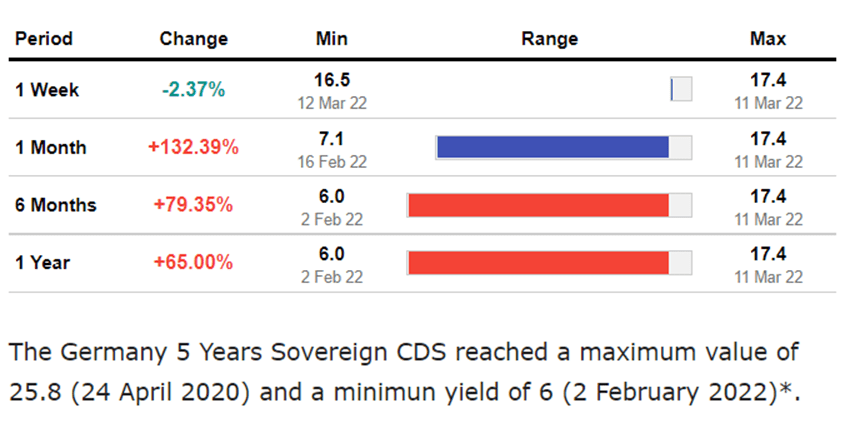
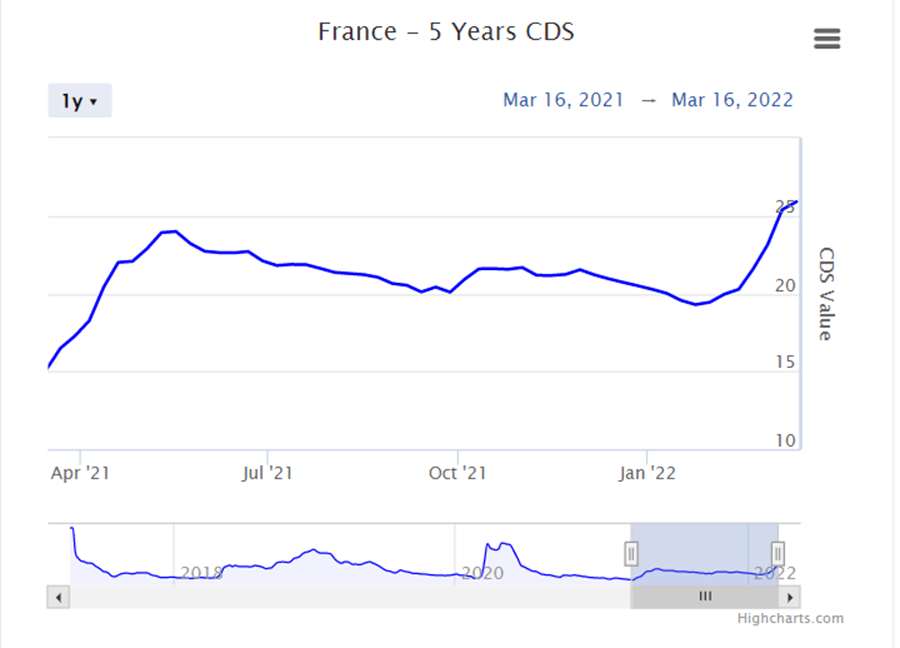
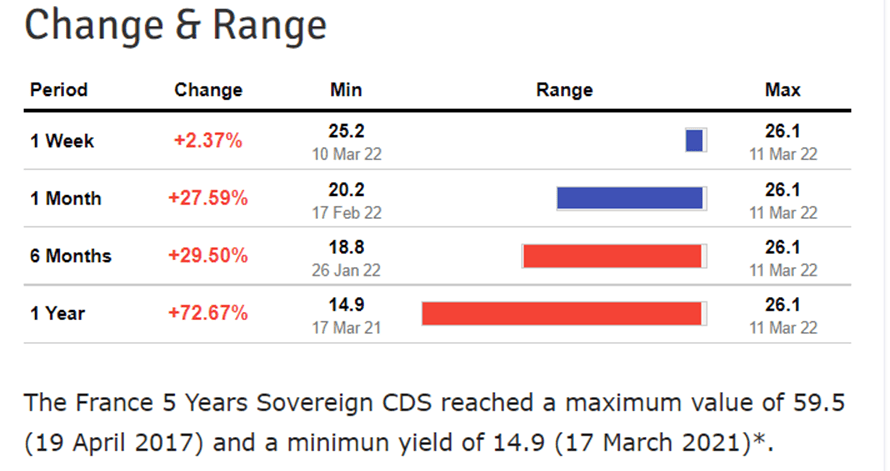
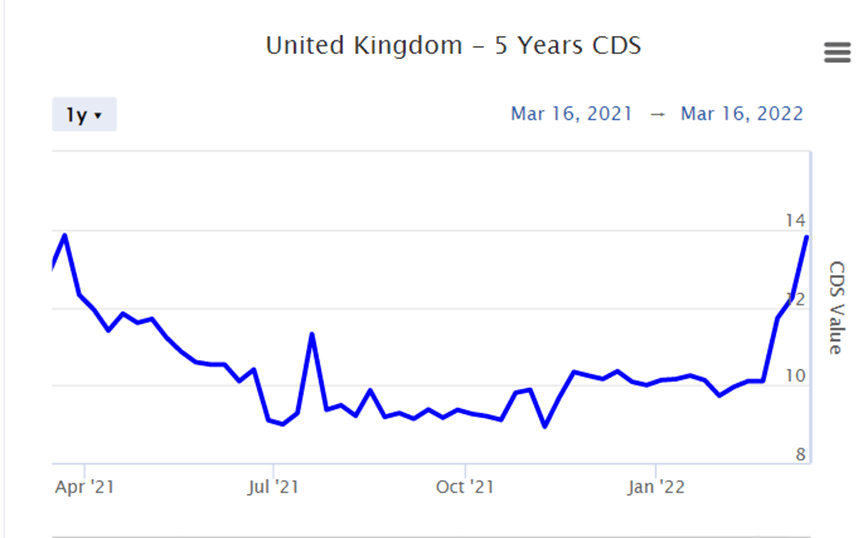
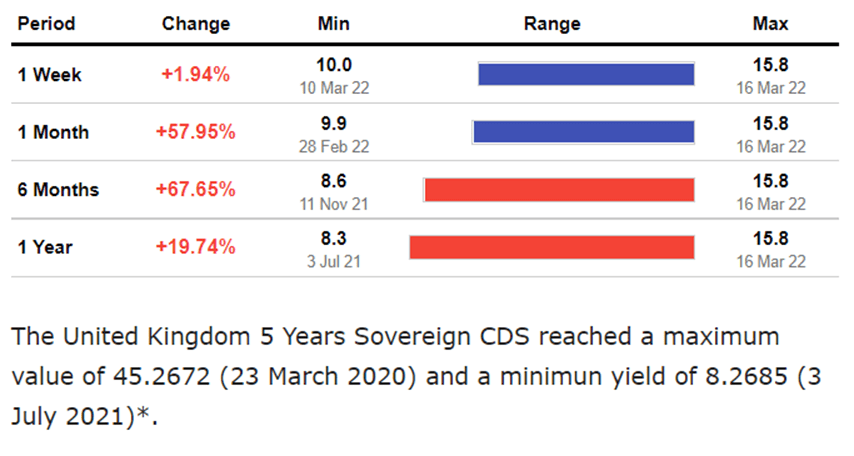
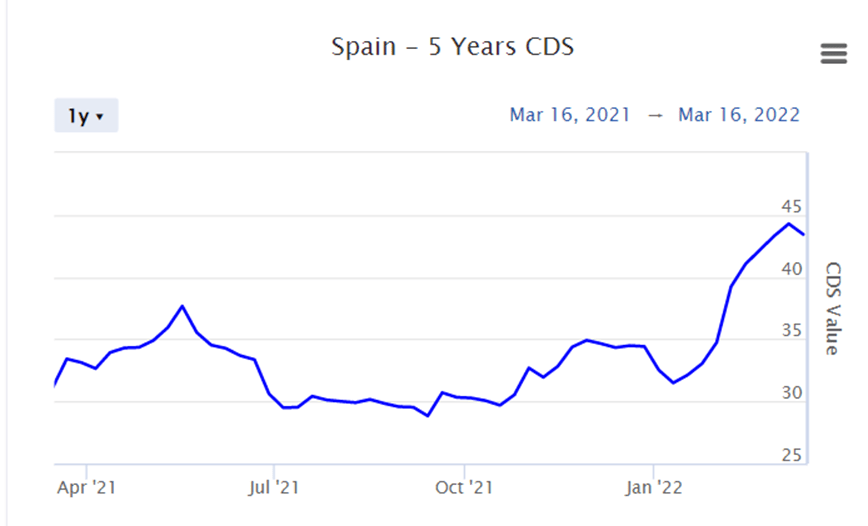
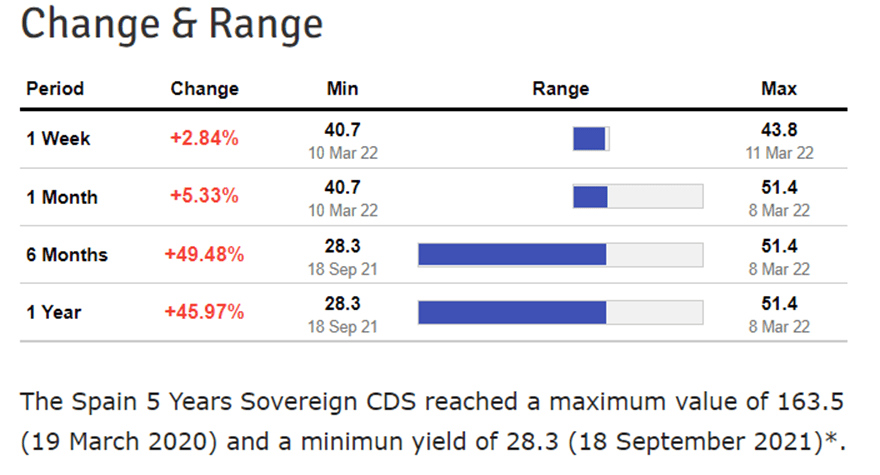
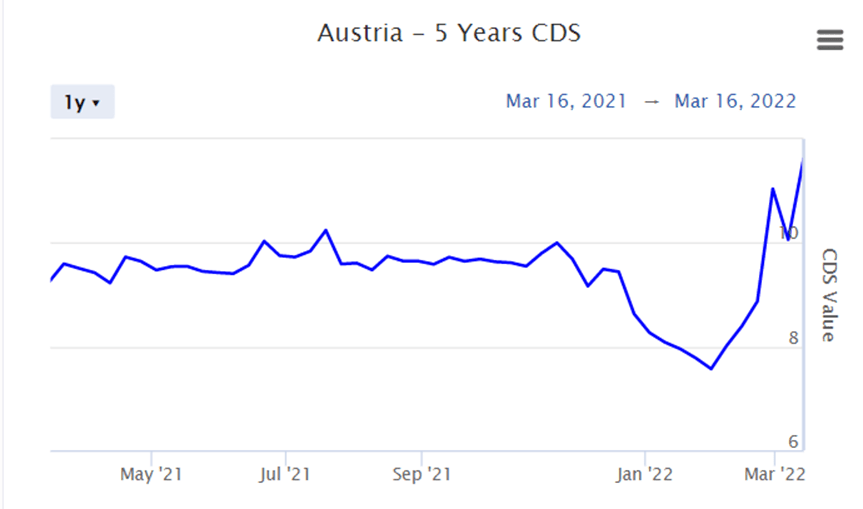
Lets have a look on following Charts of 5 years CDS of USA, Russia, Germany, China, UK, France, Spain and China:


Update on Credit Spreads
Credit spread is the difference between the quoted rates of return on two different investments, usually of different credit qualities but similar maturities. It is often an indication of the risk premium for one investment product over another.

Seeing the above chart, it reminds us of 2008 moment.
Conclusion
In the above scenario we are seeing some major tightness in debt market. As we already told many times that the global debt market is more than 5 times of global equity market. Already the level of crisis of debt on real estate market has reached to Country Garden (Largest and the strongest developer) of China. Both Evergrande and Country Garden accounts for more than $600 billion liability. So, we can imagine the exposure of Europe and US in Chinese economy. While the world is thinking Russian default as big shock but the amount of default is less than $117 million interest payment. Here we are not even concerned about half a trillion-dollar defaults ongoing with China. The massive amount of vacuum created on dent in prices of Real estate and incidental activity along with slowing down of infrastructure spending is yet to be unveiled by the market. Plus, the Covid spread in worlds largest population is adding a big dent to domestic consumption.
The second point is the amount of exposure of European Banks in Derivative market and meeting margins requirement of Clients for Commodity like Commodity trader Trafigura’s Bonds falling 17% in a few days’ time. The volatility created in commodity market has exposed the out-of-control regulations in paper market resulting through Banking system who are providing unwanted margins. Be it Nickel or Crude or Wheat or any other commodity.
Rest is left to our viewers to analyse things based on the charts as the credit is telling completely different picture.
– By Nishant Maheshwari & Vishal Vora
Disclosure: The above article is based on views expressed by the authors and are meant for information purpose only. Readers are requested to take investment decisions by consulting their financial advisors.
In case you are interested in making a contribution to our writing, please do so in the following account:
Account Number: 00000037522669317
Account Holder Name:Rashi Maheshwari
IFSC:SBIN0030115

2 thoughts on “Update on Yield Inversion, Credit Default Swaps and Credit Spread-Sign of recession”