A lot of speculation is going on with respect to China as CV19 cases are increasing multi fold after the restrictions of lockdown have been lifted. While on one side speculation is happening in USDCNY where the currency came down from 7.20 to 6.96, on the other side, Hangseng which corrected heavily during the phase of lockdown, property crisis and tech crackdown is having some upward momentum.

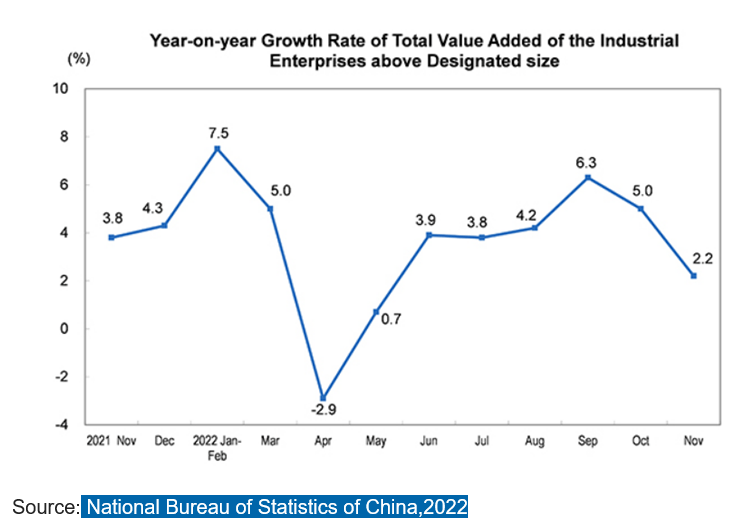
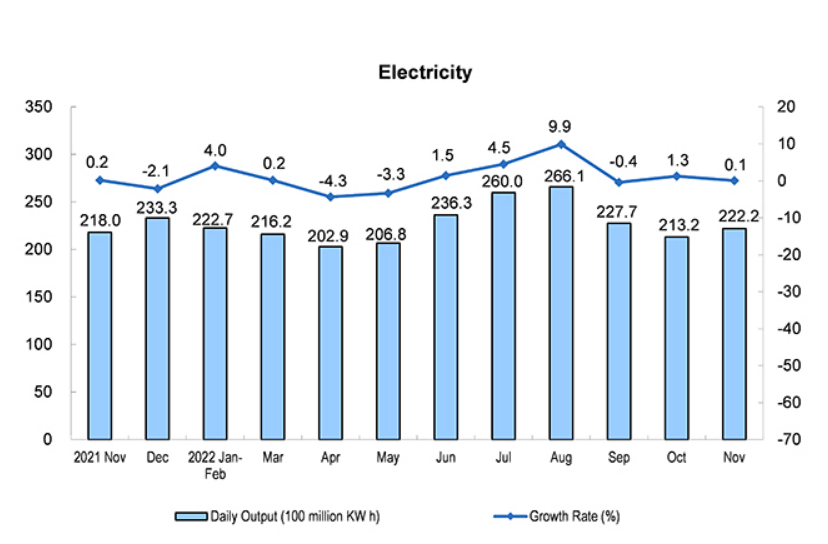
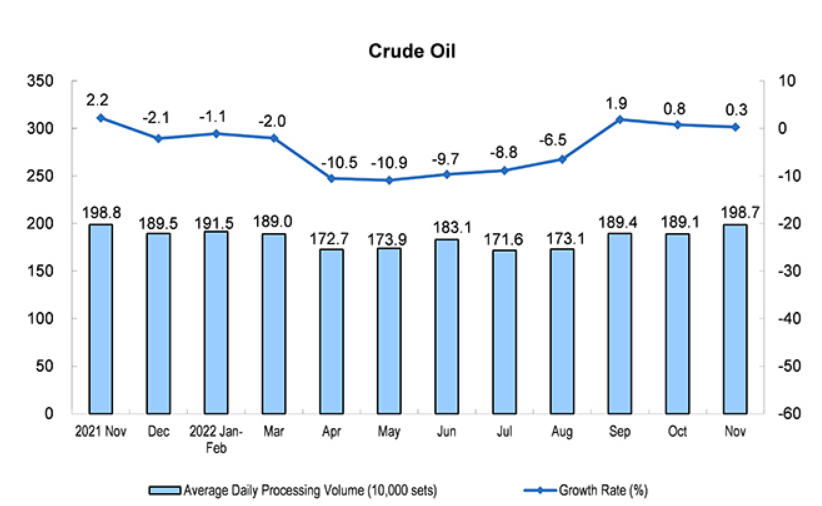
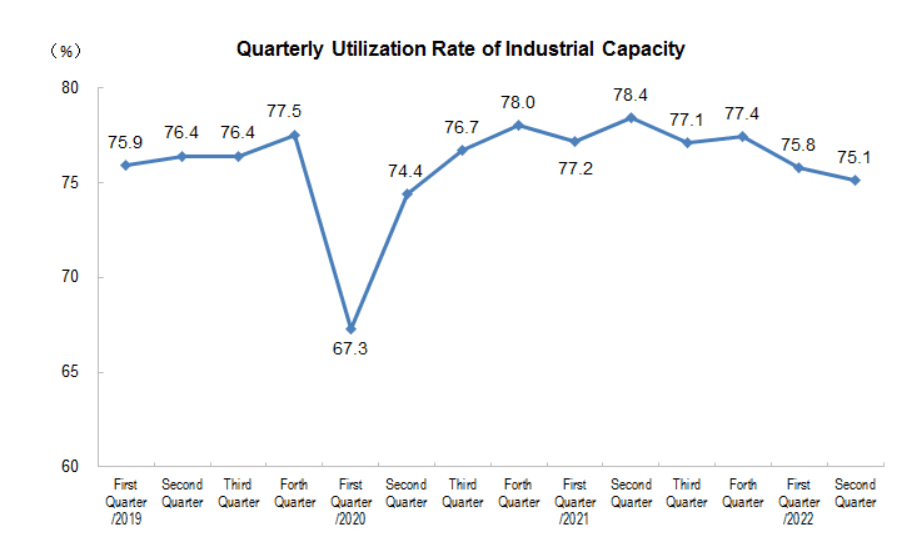
Believing the picture projected from derivative market of commodities and equity to act early on any news, China seems to be back on track with respect to Industrial manufacturing and assembling. The data below shows the actual numbers.
The Month-on-Month Growth Rate of Industrial Production Operation
| Months | Growth Rate (%) |
| 2021-November | 0.38 |
| December | 0.40 |
| 2022-January | 0.22 |
| February | 0.38 |
| March | 0.43 |
| April | -2.01 |
| May | 1.05 |
| June | 0.87 |
| July | 0.40 |
| August | 0.32 |
| September | 0.84 |
| October | 0.19 |
| November | -0.31 |
What does China reopening now means?
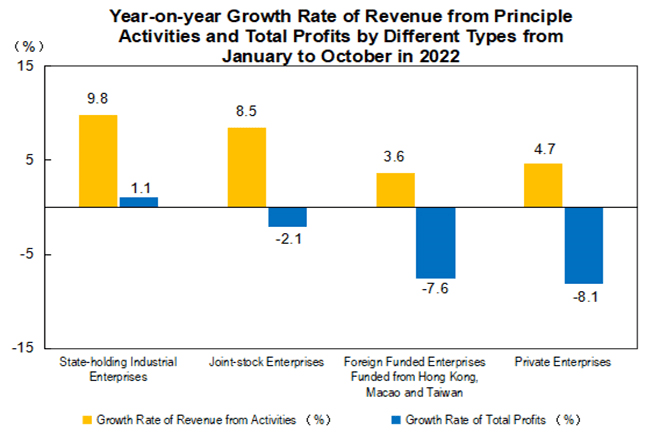
Believing data and statistics that China has restarted its production back to normal levels, what does it really means for Global Market? When it comes to anticipation and hope, it means pent up demand in commodity market, revision of credit flow globally in money supply. China holds more than 28% of World’s manufacturing which would mean relief in supply chain shortage of final products with inflow of currency in China and relief from fears of shifting manufacturing output from China to rest of the world, relief to real estate market, etc are what most expect it to be.Some data points where the sectors have been affected by the slowdown are represented with statistics.

Real Estate Investment in Eastern, Central and Western Regions for Jan-Nov
| Regions | Investment (100 million yuan) | Growth Rate Year-on-Year (%) | ||
| Residential Buildings | Residential Buildings | |||
| National Total | 123863 | 94016 | -9.8 | -9.2 |
| Eastern | 67485 | 49612 | -6.9 | -6.5 |
| Central | 26866 | 21778 | -6.3 | -6.2 |
| Western | 25655 | 19535 | -17.1 | -16.1 |
| Northeastern | 3858 | 3091 | -25.8 | -22.8 |
Sales of Commercial Buildings in Eastern, Central and Western Regions for Jan-Nov
| Regions | Floor Space of Commercial Buildings Sold | Sales of Commercial Buildings | ||
| Absolute Value (10000 Sq.m) | Growth Rate Year-on-Year (%) | Absolute Value (100 million yuan) | Growth Rate Year-on-Year (%) | |
| National Total | 121250 | -23.3 | 118648 | -26.6 |
| Eastern | 50213 | -22.8 | 68722 | -25.6 |
| Central | 36235 | -19.0 | 25230 | -24.0 |
| Western | 31054 | -27.0 | 21875 | -30.5 |
| Northeastern | 3748 | -35.9 | 2820 | -39.5 |
Realistic picture of what does China reopening really means for Global economies? While the current picture has been represented above let’s look at the data points of past which drove the Chinese Economy.
The Y/Y Growth Rate on GDP
| Q1 | Q2 | Q3 | Q4 | |
| 2017 | 7.0 | 7.0 | 6.9 | 6.8 |
| 2018 | 6.9 | 6.9 | 6.7 | 6.5 |
| 2019 | 6.3 | 6.0 | 5.9 | 5.8 |
| 2020 | -6.9 | 3.1 | 4.8 | 6.4 |
| 2021 | 18.3 | 7.9 | 4.9 | 4.0 |
| 2022 | 4.8 | 0.4 | 3.9 | |
| Notes: The Y/Y growth rate is the growth rate over the same period last year. Source: | ||||


The leverage and debt position of China is telling its realistic GDP picture. The GDP was more driven by Debt rather than Growth.
Further this debt which later became bad debts were absorbed by ARC’s like China Great Wall Asset Management Corporation (CGWAMC), China Orient Asset Management Corporation (COAMC), Cinda Asset Management Corporation (CAMC), Huarong Asset Management Corporation (HAMC) etc since 2008. The data point of role of ARCs in absorbing bad debts is as under:
Source: HAMC Annual Report reflecting $62.21 Billion of stressed debt instruments and $126.87 Billion stressed assets.
Great Wall, the smallest of China’s four bad-debt managers with $94.64 billion of stressed assets.
Source: Annual report of CAMC reflecting $205 Billion of stressed assets
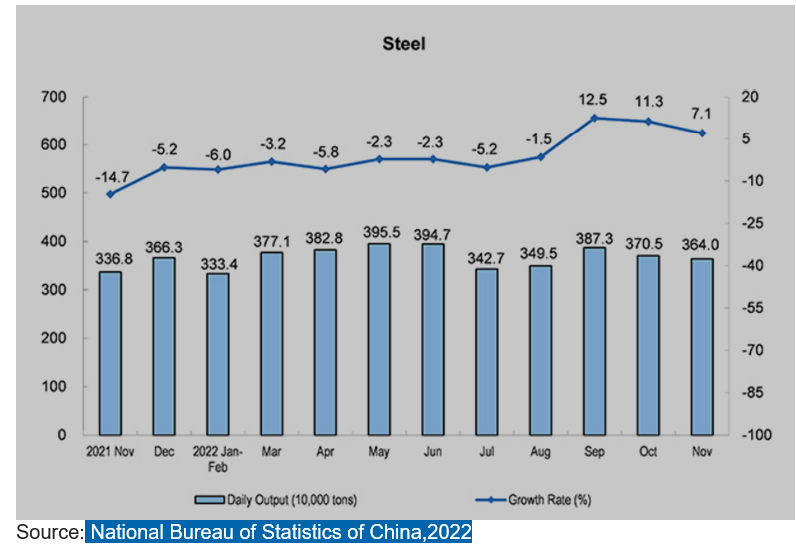
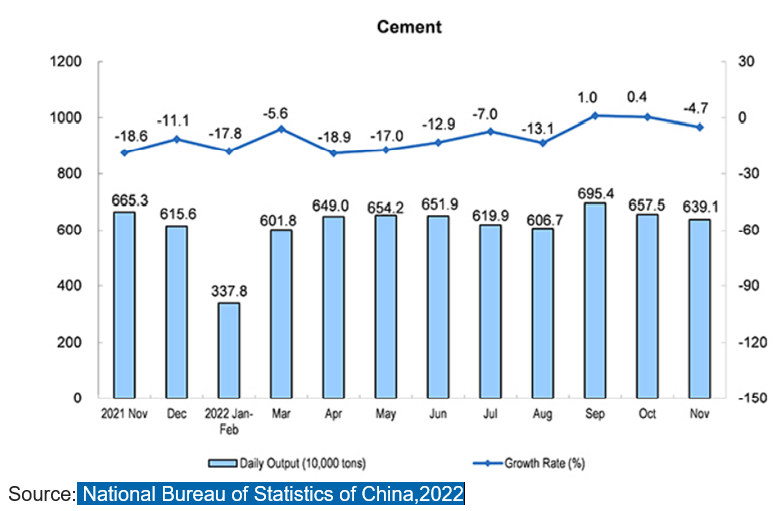
Chinese LGFVs were biggest drivers of revenue to the exchequer through real estate boom. LGFV’s land transaction supported by large Chinese developers rotated money flow fast globally. The appetite of real estate developers was enlarged when they started floating Bonds in Global market. Not only BlackRock but various European and US institutions also participated in it. When Chinese real estate investment needs was not fulfilled through Bonds, another financial product was floated by developers themselves. Now people started directly financing developer’s non-banking company for assured returns. These all factors directly made top five real estate companies of China to undertake more than 800 projects at a time. Even the largest company like Country Garden undertook more than 200 projects at time. While the demand along with appreciation in real estate price was crazy in last decade as property has been seen as a stable source of growth by households, it became contributor of more than 30% of GDP directly or indirectly. Due to this the surplus capacity of essential commodities like Steel, Cement, etc. has grown abnormally.
Next comes the Fiscal spending of China which directly and indirectly boosted the Infrastructure growth of China. The mega structure projects of China costed more than 3 trillion dollar to exchequer and constituted more than 20% of GDP. Even as on day china has pledged more than 1 trillion dollar for infrastructure growth.
Constant capex cycle and infra growth derived the demand for commodities while exports bought significant foreign capital in last decade. The export market and pegged currency kept China exporting deflation and helped central government globally to keep Inflation hidden. Though central banks globally concentrated on structured Quantitative easing to ease hidden Inflation in data, China created value addition in exporting deflation globally.
What’s next for China and rest of the world?
While PBOC is injecting lots of liquidity in the market and intervention of central banks has stabilized money market and suppressed the real problem of China, the world has undergone into liquidity tightening phase where central Banks like Fed have absorbed 400 billion dollar liquidity from market since inflation started rising this cycle. Rates are at 4.5% for US 10 Treasuries.
Let’s further analyze the export pie chart of China:
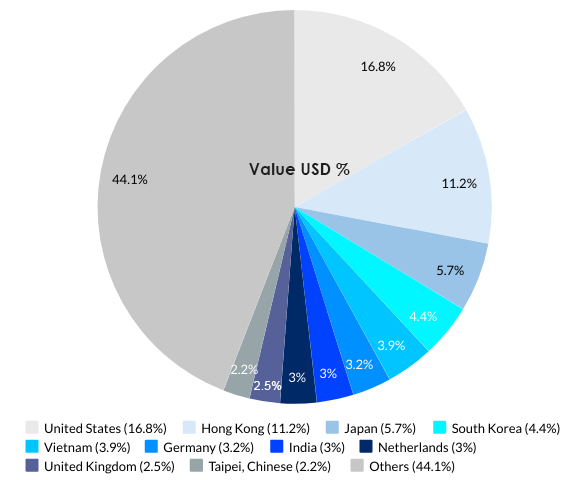
The largest consumer of Chinese export is US and Europe, so the impact on exports during the phase of liquidity tightening in US and Europe will be severe. The spike in interest rate by Fed and ECB will further create dollar shortage for rest of the world and many of these countries will not be willing to buy goods from China at the pace seen before the pandemic and that too at pegged currency rate.
With no stimulus cheques, closing of swaps by Fed and PPI Consumer Confidence in Europe and US telling that the road to recession is clear, the reopening of China will mean killing of domestic industries of these countries and lack of demand for Chinese surplus inventories thereby creating accumulation of inventory globally.
When the capacity reaches peak level, the demand must pick up within reasonable intervals to keep production capacity running constantly. However, with sluggish Demand scenario in recessionary environment, such capacity addition to the global market will prove to be fatal as it will further depress the prices and demand. This time we have one more variable is in play which carries maximum weight to recession i.e. liquidity. In 2008 crisis, China helped the world by controlling commodity market and driving global growth through creation of debt and drivers like real estate and financial market.
However, at present due to crash in property, real estate, bond prices, technology crackdown, bankruptcy position of LGFVs & ARCs etc in China, the only option left to gain confidence amongst creditors is to transfer ownership of Chinese private entity to Government. Govt. Trust and guarantee can fill those cracks which were created by Chinese Government itself. Till that time, lots of injection of liquidity will be needed to revive consumer confidence which may even save rather than spend given the job losses.
Summary
It is globally known phenomena that USA and the developed world especially have a challenging demography that calls for constant central bank intervention to keep the economy afloat. Their low interest rate regime has created inflation to fight deflation. However, the same central banks rely on China to supply cheap goods and interest rates not rising beyond a certain point. The western world thus creates inflation through its policies and China creates the deflation by flooding the world with its goods and services. Currently the world is not in sync due to pandemic and supply chain has been impacted for past 2 years creating ebb and flow and thus impacting interest rates, inflation and currencies as well. We have seen the impact of inflation and rising interest rates when the western world generated 12 trillion plus liquidity to fight the impact of pandemic. Now we shall see the resulting deflation as China brings its supply to the market at a time when the stimulus is waning and liquidity is been withdrawn.
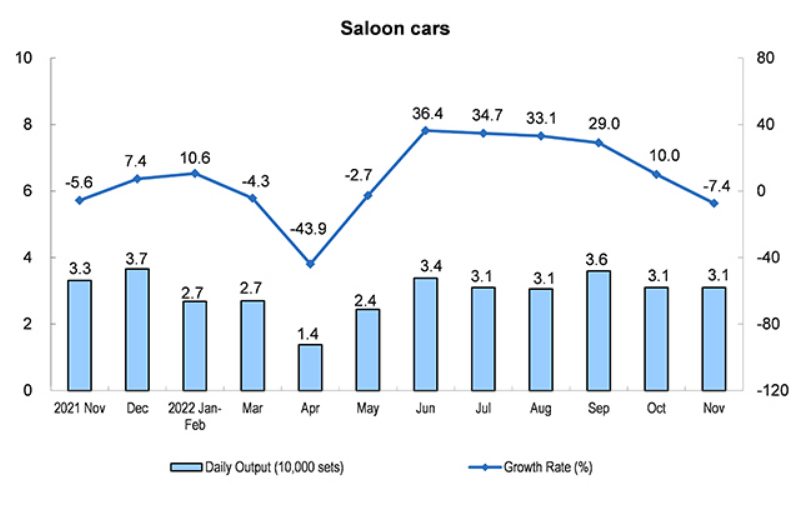
A classic example of Chinese Supply and its problem of upcoming accumulation of inventory is Tesla. Mere price reduction of cars in China gives us evidence of upcoming Inventory problems. Imagine a person who bought Tesla car on credit at higher price and other person buying same car at reduced price. What kind of anger and frustration that person will be feeling?
The problem for China and the global world is that it has tried to manage the debt problem through injections of liquidity for far too long and have let them become big enough to impact financial stability.
As world needs higher levels of stimulus to keep this growth intact, it becomes even more difficult to intervene and costly. We have seen in history how the excesses of 1920s led to a lost decade of 1930s. That it may happen again is not out of the realm. China may force the world to enter a deflationary spiral by exporting deflation through its exports which will help ease supply chains but also create a pressure on Central banks to fight deflation there by leading many countries to chase dollars as seen in the past whenever the USA has entered recession. A second recession in 3 years will impact the world economy harder as the size of the debt bubble increases. It may force other countries to go further in to debt to ensure that there is no social unrest in their country.
The FED will then be helpless as it unleashes a bazooka that puts the world back into inflation. China may well sow seeds for inflation for it needs those dollars too at this time to fight its own battles.
There seems to be no end to this global cycle of instability as the economy keeps moving from inflation to deflation while the business cycle shortens. At some point we shall see rapid moves in inflation and deflation cycle which will create a bigger issue of either a depression or hyperinflation. Till that time is reached we have time to prepare.
Join us on a learning experience and develop the edge of understanding market events so that you are able to negotiate the volatile macro environment and distortions in the markets. For more details on group, please review the link provided below:
From CA Nishant Maheshwari and Vishal Vora
Disclosure: This article is for information only and should not be construed as a financial advice.
In case you are interested in making a contribution to our writing, please do so in the following account:
Account Holder Name:Rashi Maheshwari
IFSC:SBIN0030115
Name of the Bank:SBI India, YN Road Branch, Indore, India
Account Number: 00000037522669317`
