People generally believe that fixed source of Income are better than variable source of Income. In this category, Deposits and rental sources are considered as safest source of Income. However, after Silicon Valley Bank, First Republic Bank, Credit Suisse and Signature Global Bank, deposit holders are losing trust in Banking system but they are not aware of the looming real estate crisis.
Development of REITS products
This product was introduced by Congress in 1960 to give all investors, especially small investors, access to income-producing real estate, REITS created ample of opportunity for these small shareholders to invest amount in expensive properties through units. Post 1960, the U.S. REIT approach has flourished and served as the model for around 40 countries around the world.
Fixed Source of Income
As per regulations of Internal Revenue Code (IRC), every REITs (Public or private) must pay out 90% or more of their taxable profits to shareholders in the form of dividends although REIT investors who receive these dividends are taxed as if they are ordinary income.
So, imagine a country like US where deposits and savings give nominal return of 0-1% in case of large Banks, the REITS holders are getting 2-4% on capital invested with marginal risk. A lot of investors moved towards this product with the aim to earn and own property through units of REITS.
Model of REITS
REITs usually have a straight business model: The Real Estate Investment Trust (REIT) leases space and collects rents on the properties, then distributes that income as dividends to shareholders. However, in case Mortgage REITs, they do not own real estate, but finance real estate. The income derived from Mortgaged REITs is Interest income on such finance.
Types of REITS
Usually, we have three types of REITs:
- Equity REITs. One of the most prominent REITs are equity REITs, which own and manage income-producing real estate. Revenues are generated primarily through rentals whose net incomes are distributed in the form of dividends after tax computation. The nature of real estate can be commercial building or Residential building.
- Mortgage REITs. Mortgage REITs lend money to real estate owners and operators either directly through mortgages and loans, or indirectly through the acquisition of mortgage-backed securities (Debentures primarily secured with Real estate project with Pari Passu clause-Equal footing). Their earnings are generated through difference of margin—the spread between the interest they earn on mortgage loans and the cost of funding these loans. This model makes them risky as they are sensitive to interest rate increases.
- Hybrid REITs. These REITs are combination of Equity REITs and Mortgage REITs.
Problem with REITS at present
In an environment of rising interest rates, the economy must experience pangs, and as such, all matters tethered to it become tentative. One would think that the housing market would make a quicker descent. In some areas, that may turn out to be the case, in others, there is an abstraction called the REIT.
Before analyzing the problem, lets look at the correction level in REITS:
| Share Price ($) | Debt | ||||||
| 52 Week | Ratio | ||||||
| Name | Ticker | High | Low | % Correction | (%) | Dividend Yield | |
| Hudson Pacific Properties | HPP | Office | 28 | 5.48 | 80.43 | 78.7 | 17% |
| SL Green Realty | SLG | Office | 81.2 | 19.96 | 75.42 | 73.8 | 17% |
| Vornado Realty | VNO | Office | 45.32 | 12.96 | 71.40 | 68.3 | 15% |
| Brandywine Rity | BDN | Office | 14.15 | 4.13 | 70.81 | 65.3 | 18% |
| Kilroy Realty | KRC | Office | 78.04 | 27.61 | 64.62 | 49.1 | 8% |
| Boston Properties | BXP | Office | 130.24 | 47.37 | 63.63 | 55.4 | 8% |
| Piedmont Office Realty Trust CIA | PDM | Office | 17.34 | 6.53 | 62.34 | 64.3 | 12% |
| Office Properties Income Trust | OPI | Office | 26.18 | 10.95 | 58.17 | 79.1 | 19% |
| Highwoods Prop | HIW | Office | 46.59 | 19.82 | 57.46 | 51.6 | 10% |
| American Assets Trust Inc. | AAT | Diversified | 38.71 | 16.48 | 57.43 | 44.6 | 8% |
| Service Properties Trust | SVC | Diversified | 11.31 | 4.83 | 57.29 | 83 | 5% |
| Essex Prop Trust | ESS | Apartments | 359.31 | 196.17 | 45.40 | 29.6 | 4% |
| LXP Industrial Trust | LXP | Industrial | 15.99 | 8.81 | 44.90 | 35.1 | 5% |
| Alexandria Real Estate Equity | ARE | Life Science | 206.25 | 116.06 | 43.73 | 31.6 | 4% |
| Camden Property | CPT | Apartments | 175.21 | 98.65 | 43.70 | 23.3 | 4% |
| Apartment Inv Management | AIV | Apartments | 9.6 | 5.43 | 43.44 | 50.4 | 0% |
| Healthcare Realty Trust Inc | HR | Health Care | 32.01 | 18.11 | 43.42 | 43.9 | 7% |
| Healthpeak Properties Inc | PEAK | Health Care | 35.4 | 20.23 | 42.85 | 33.4 | 4% |
| Prologis | PLD | Industrial | 173.01 | 98.9 | 42.84 | 20.2 | 3% |
| Ventas Inc | VTR | Health Care | 62.86 | 36.04 | 42.67 | 40.9 | 4% |
| Digital Realty Trust | DLR | Data Centers | 152.67 | 89.22 | 41.56 | 37.8 | 5% |
| Welltower Inc. | WELL | Health Care | 97.82 | 57.37 | 41.35 | 33 | 4% |
| Equity Residential | EQR | Apartments | 93.24 | 55.46 | 40.52 | 25.2 | 6% |
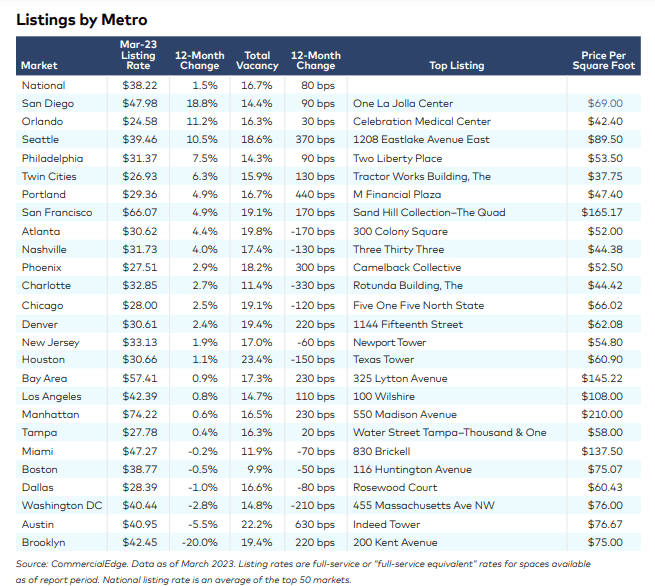
The real problem arising in this sector is rising vacancy rate to double digit in US creating trouble in cash flows of this market. With big Fang stocks constantly reducing administrative cost while the lack of funding in startup forcing them to shut down operations. Further, rising bankruptcy also stating trouble for commercial real estate. Chart below states the picture:
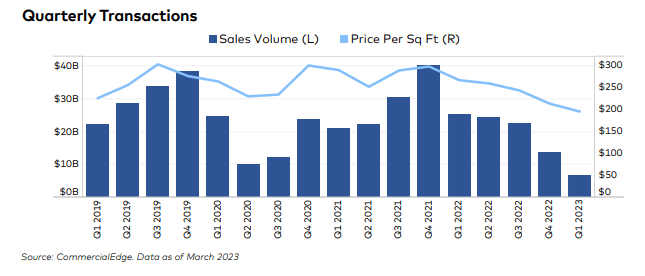
With rapid decline in the sales volume along with decline in price of properties creates the real problem visible in real estate market. The core reason for same is rising interest rates.
Let’s further look into the REITS debt wise
| List of U.S. REITs | ||||
| Symbol | Name | Industry | Market cap | Debt as on 31.12.2022 (in Billion $) |
| INVH | Invitation Homes Inc | REIT—Residential | $17,53,52,80,673.00 | 77.67 |
| AMT | American Tower Corporation | REIT—Specialty | $89,22,70,97,059.00 | 38.90 |
| SPG | Simon Property Group, Inc | REIT—Retail | $33,47,04,23,118.00 | 24.96 |
| PLD | Prologis, Inc | REIT—Industrial | $1,05,40,94,20,350.00 | 23.87 |
| DLR | Digital Realty Trust, Inc | REIT—Office | $27,23,90,78,580.00 | 16.72 |
| CCI | Crown Castle International Corp. | REIT—Specialty | $53,63,78,89,883.00 | 15.81 |
| WELL | Welltower Inc | REIT—Healthcare Facilities | $32,26,47,48,782.00 | 14.58 |
| BXP | Boston Properties, Inc | REIT—Office | $7,42,86,91,394.00 | 13.75 |
| SBAC | SBA Communications Corporation | REIT—Specialty | $26,67,48,17,990.00 | 12.84 |
| VTR | Ventas, Inc | REIT—Healthcare Facilities | $16,67,57,32,392.00 | 12.29 |
| ARE | Alexandria Real Estate Equities, Inc | REIT—Office | $20,08,84,87,317.00 | 10.59 |
| AVB | AvalonBay Communities, Inc | REIT—Residential | $21,55,74,90,885.00 | 8.38 |
| EQR | Equity Residential | REIT—Residential | $20,99,73,04,855.00 | 7.48 |
| CIO | City Office REIT, Inc | REIT—Office | $24,00,30,091.00 | 6.90 |
| PSA | Public Storage | REIT—Industrial | $49,61,64,75,633.00 | 6.86 |
| EXR | Extra Space Storage Inc | REIT—Industrial | $20,14,92,16,174.00 | 6.38 |
| HPP | Hudson Pacific Properties, Inc (Short term Mturity is 4.66 Billion) | REIT—Office | $77,30,27,377.00 | 5.32 |
| UNIT | Uniti Group Inc | REIT—Specialty | $78,76,79,741.00 | 5.20 |
| SLG | SL Green Realty Corp | REIT—Office | $1,28,47,35,560.00 | 5.17 |
| MAA | Mid-America Apartment Communities, Inc | REIT—Residential | $16,32,26,68,952.00 | 4.41 |
| WY | Weyerhaeuser Company | REIT—Specialty | $20,72,54,20,100.00 | 4.07 |
| OPI | Office Properties Income Trust | REIT—Office | $53,17,76,928.00 | 2.42 |
| BDN | Brandywine Realty Trust | REIT—Office | $70,92,35,413.00 | 1.96 |
| AFCG | AFC Gamma, Inc. | REIT—Specialty | $24,68,95,270.00 | 0.97 |
| CMCT | CIM Commercial Trust Corporation | REIT—Office | $9,56,39,153.00 | 0.18 |
| MPW | Medical Properties Trust, Inc | REIT—Healthcare Facilities | $4,34,96,41,000.00 | 10.26 |
| VNO | Vornado Realty Trust | REIT—Office | $2,48,65,94,765.00 | 8.38 |
| RTL | The Necessity Retail REIT, Inc. – Class A | REIT—Diversified | $77,17,89,800.00 | 2.30 |
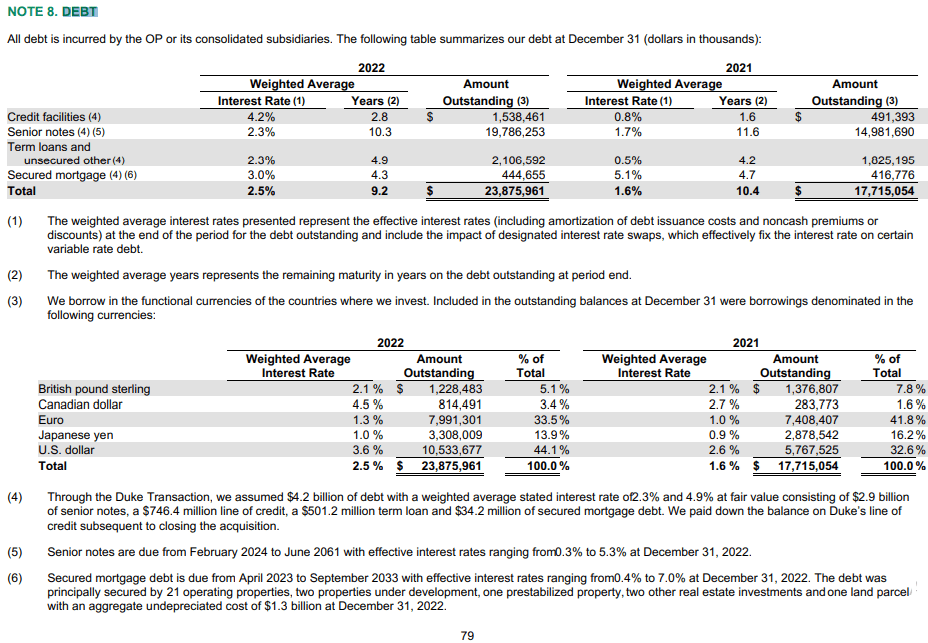
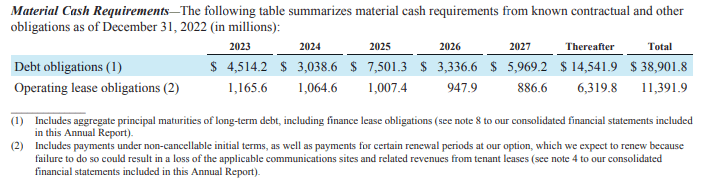
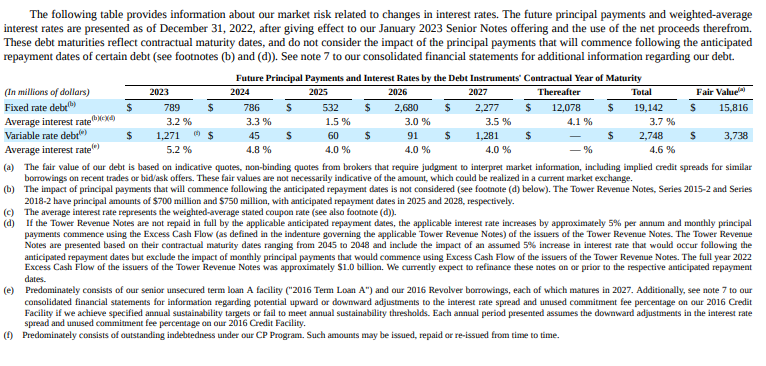
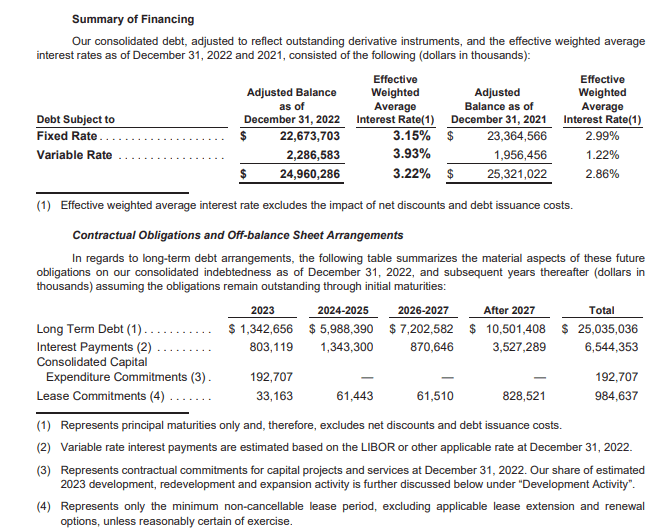
The detailed debts as per Annual report of top REITS is as under:
(a)Invitation Homes
Source: Annual Report 2022
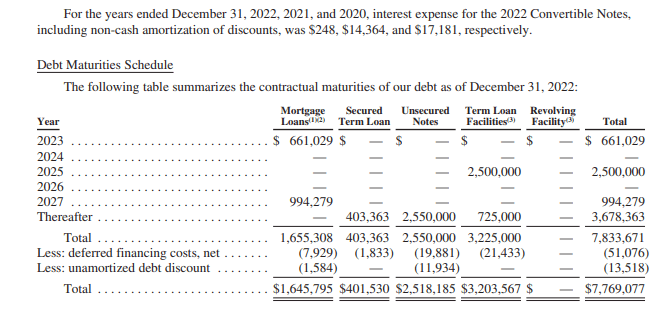
(b) Digital Reality Trust
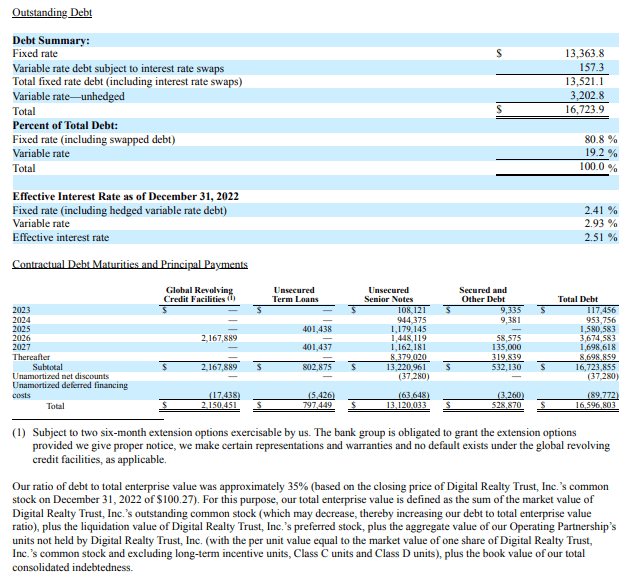
Source: Annual Report 2022
American Tower Corporation
Source: Annual Report 2022
(d) Crown Castle International Corp.
Source: Annual Report 2022
(e) Simon Property Group, Inc
Source: Annual Report 2022
Problem for Banks
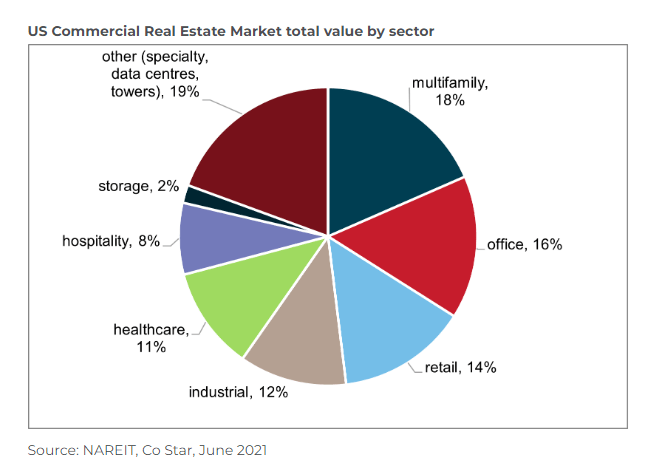
According to the National Association of Real Estate Investment Trusts (NAREIT), the total value of the US commercial real estate market was estimated to be approximately US$20 trillion, of which US REITs represent around US$1.7 trillion.
Source: Citi Research and Federal Reserve
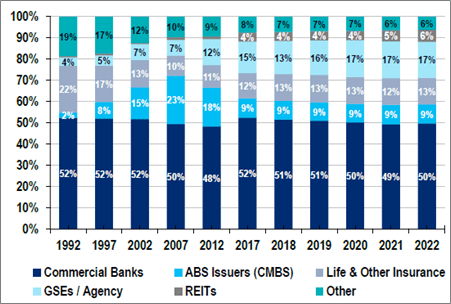
In current scenarios where US bank (small / regional banks) failed on account of Asset Liability, attention has naturally turned to how important these banks are to the commercial real estate market. The Mortgage Bankers Association (MBA) defines smaller banks as those outside of the top 25 largest banks by total assets. As per Mortgage Bankers Association’s (MBA), around 4690 US smaller banks account for around US$2.1 trillion of all CRE loans which accounts for 38% of total mortgage debt outstanding.6
The component of commercial mortgage lending of smaller banks is therefore meaningful component of in the US. If we exclude lending to owner occupied properties and farmland, small banks in US accounts for around US$1.6 trillion of debt on income-producing commercial real estate i.e 8% of the US$20 trillion estimated size of the CRE market.
It is important to note that smaller/regional banks are immaterial lenders to listed US REITs. Even credit Suisse is also not involved in lending to Listed REITS. The major exposure is of Deutsche Bank.
However, considering the current troubled banks exposure to the REIT sector, we believe that distress within the banking sector will undoubtedly result in further tightening of lending conditions which will have a dampening effect on the broader commercial real estate market, particularly those sub-sectors facing operational challenges and high capital expenditure requirements such as the office sector.
Conclusion:
The 40 year bond bubble and sliding yields on bonds have made everyone complacent. Even during the 2008, the bonds provided a safe haven for investors and many were able to protect their investments. The Federal Reserve has created a sense of complacency and it was further evident when they forced the rates down to 0 leading to a crypto bubble, the bond bubble, the housing market bubble and valuations bubble. Other central banks too have helped create this risk-free environment.
We have seen the crypto bubble burst in 2022 followed by the bond bubble and the valuation bubble in equity. What we are now seeing is second order effects of the quick tightening made by the Federal Reserve. Hardly have they raised rates by 5% in such short period of time. The expectation that such spike in rates can still be managed and allow for a soft landing is a fallacy. Till date the market is managing to keep things stable due to liquidity injections since the Credit Suisse shock in October 22. However, such liquidity injections will only delay the inevitable. Inflation even though on a downward trend is still persistently high and nowhere near the Fed target of 5%. The market is hoping a quick downward movement in inflation forcing the Fed to cut rates and hence risk assets are still elevated in the hope of seeing a quick easing. But such easing can accelerate the inflation cycle again. We are now in a period where we might easily see a quick deflation followed by further easing leading to another cycle of inflation. Interest rates therefore are likely to remain elevated along with inflation. The impact will therefore remain for a longer period with defaults likely. This is again likely to put more pressure on regional banks. It seems we are going to see more bubbles burst before we see a short period of normalization. Central banks are on a thin road but they are navigating it for the time being. Investors are hoping the Fed will fold and stop bursting these bubbles. For now, the tail wags the dog.
From CA Nishant Maheshwari and Vishal Vora
In case you are interested in making a contribution to our writing, please do so in the following account:
Account Number: 00000037522669317
Account Holder Name:Rashi Maheshwari
IFSC:SBIN0030115
Name of Bank:State Bank of India, YN Road, Indore
Join us on a learning experience and develop the edge of understanding market events so that you are able to negotiate the volatile macro environment and distortions in the markets. For more details on group, please review the link provided below:

One thought on “Debt threat from US REITS-The Next bubble in US market”